

A candlestick pattern is a type of chart that is used to predict future price movements of an asset. Candlestick patterns are created by plotting price data on a chart. The data includes the open, high, low, and close price for a given period of time. There are many different candlestick patterns that can be used to predict price movements.
Some of the more common patterns include the following: -The hammer -The inverted hammer -The shooting star -The hanging man -The doji Each of these patterns has a specific meaning and can be used to predict whether an asset’s price will move up or down in the future.
What is a candlestick pattern?
A candlestick pattern is a specific on-chart formation that results in a trade signal. Candlestick patterns are used by traders to identify potential market reversals, continuations, and breakout opportunities.
There are many different candlestick patterns, each with its own specific meaning. Some of the more popular candlestick patterns include the hammer, inverted hammer, shooting star, doji, and engulfing pattern.
The interpretation of candlestick patterns is not an exact science, and there is often debate among traders as to which formations are the most reliable. However, with experience and practice, traders can develop a keen eye for spotting these valuable patterns.
How to Read a Candlestick Pattern
There are a few things to keep in mind when reading a candlestick pattern. The first is the shape of the candlesticks. Candlesticks can be either bullish or bearish, and each has a different meaning.
Bullish candlesticks are typically longer than bearish candlesticks, and their bodies (the part of the candlestick between the open and close) are typically green or white. Bearish candlesticks, on the other hand, are typically shorter than bullish candlesticks, and their bodies are typically red.

The second thing to keep in mind when reading a candlestick pattern is the size of the candles. Large candles tend to be more significant than small candles, and they often indicate a change in market sentiment.
The third thing to keep in mind when reading a candlestick pattern is the number of candles in the pattern. Some patterns only require two candles, while others may require three or more. The more candles there are in a pattern, the more significant it is likely to be.
Finally, it’s important to remember that no single candlestick pattern is guaranteed to produce profits. However, by understanding how to read them correctly, you can give yourself an edge in your trading decisions.
How to use candlestick patterns to trade
Candlestick patterns are a useful tool for traders to identify potential trading opportunities. There are many different candlestick patterns, each with its own meaning.
Each candlestick represents a specific time period, such as 1 minute, 5 minutes, 1 hour, etc. The open and close prices represent the high and low prices for that time period. The wicks represent the highest and lowest prices reached during that time period.
The most important thing to remember about candlestick patterns is that they are reversal patterns. This means that they indicate a potential change in the direction of the market.
There are two main types of candlestick patterns: bullish and bearish. Bullish patterns indicate a potential move to the upside, while bearish patterns indicate a potential move to the downside.
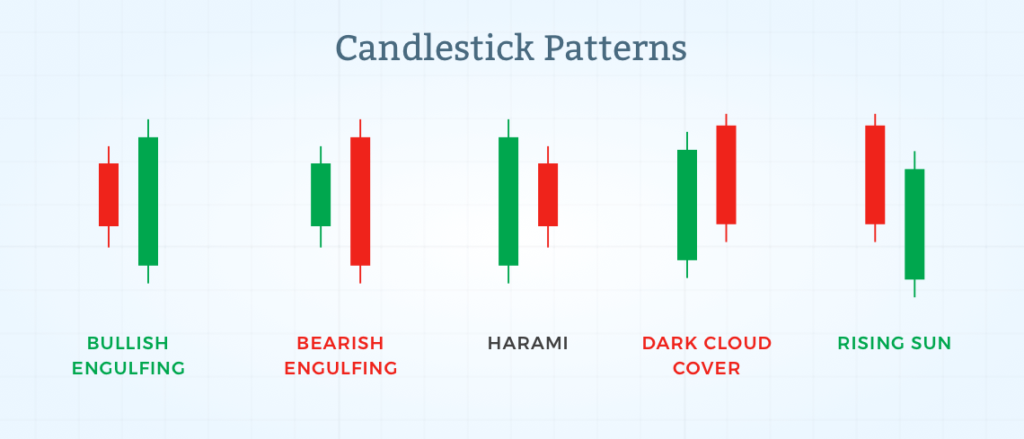
Some of the most common bullish candlestick patterns include the hammer, inverted hammer, morning star, and evening star. Some of the most common bearish candlestick patterns include the shooting star, hanging man, dark cloud cover, and Tweezer Top/Bottom.
It is important to note that no one pattern is 100% accurate all of the time. However, when multiple patterns line up with other technical indicators (such as support/resistance levels), it can provide traders with a higher degree of confidence in their trades.
The common candlestick patterns
There are many different candlestick patterns that can be useful in predicting future price movements. Some of the most common patterns include:
- -The doji: A doji is a candlestick with a small body and long, equal-sized shadows. It occurs when the open and close prices are the same (or very close to the same). A doji indicates indecision in the market and can be a sign of future price movement (usually reversal).
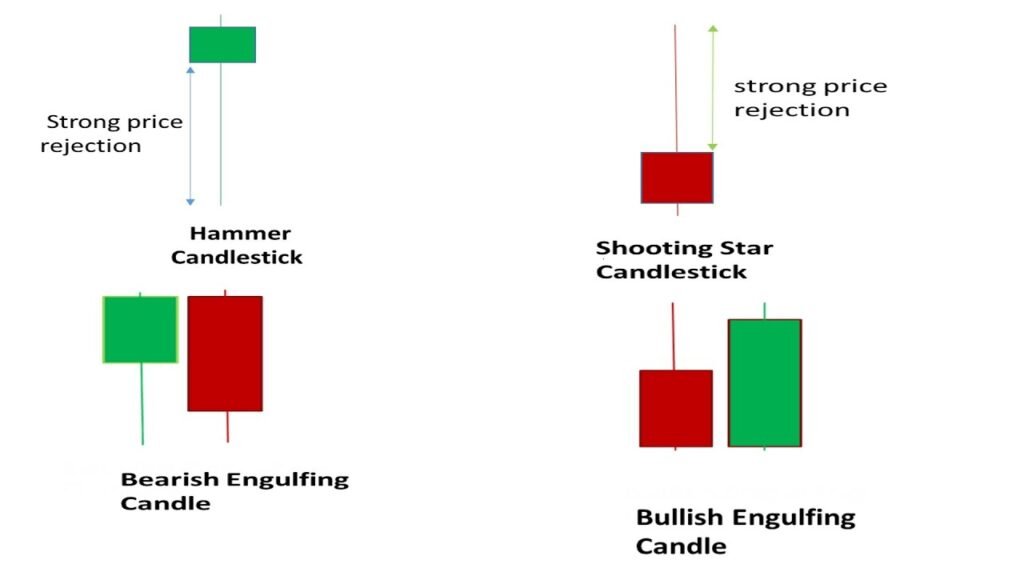
- -The hammer: The hammer is a candlestick with a small body and a long lower shadow. It occurs when the market has been falling but then rebounds to close near the open price. This pattern can indicate a potential bottom in the market and possible future price movement (usually up).
- -The inverted hammer: The inverted hammer is the opposite of the hammer; it has a small body and a long upper shadow. It occurs when the market has been rising but then falls back to close near the open price. This pattern can indicate a potential top in the market and possible future price movement (usually down).
Candlestick pattern trading strategies
Candlestick patterns are a useful tool for traders to identify potential trading opportunities. There are many different candlestick patterns, each with its own meaning and implications.
One popular candlestick pattern is the hammer. The hammer pattern occurs when the price of a security drops sharply, but then rallies to close near the opening price. This pattern indicates that there may be support at the current level and that the market may be due for a rebound.
Another popular candlestick pattern is the head and shoulders. This pattern occurs when the price forms two highs, with a lower high in between. This is considered a bearish pattern and often signals that the market may be ready to reverse course.
These are just two of the many different candlestick patterns that traders use to try to identify potential trading opportunities. As with all technical analysis tools, it is important to remember that candlestick patterns are not perfect and that they should be used in conjunction with other indicators to form a complete picture of market conditions.
Examples of Candlestick Patterns
There are many different candlestick patterns that can be used to predict future price movements. Some of the more popular patterns include the hammer, inverted hammer, shooting star, and doji.
The hammer pattern is created when the market is in a downtrend and the price creates a long lower shadow followed by a small body with a close near the high of the day. This shows that buyers are starting to step in and push prices higher.
The inverted hammer happens when the market is in an uptrend and the price creates a long upper shadow followed by a small body with a close near the low of the day. This indicates that sellers are beginning to come in and push prices lower.
The shooting star pattern occurs when the market is in an uptrend and the price creates a long upper shadow followed by a small body with a close near the low of the day. This shows that sellers are starting to take control and push prices lower.
The doji is perhaps one of the most important candlestick patterns as it can be found at key turning points in the market. A doji is created when the open and close are equal or very close to each other, creating a small body with long shadows on either side. This indicates that there is indecision in the market and that prices could potentially move in either direction.
Does candlestick pattern analysis really work
Candlestick patterns are one of the most popular ways to analyze stock prices, but does this method really work?
There are many different candlestick patterns, each with its own interpretation. Some patterns are more reliable than others, but even the most reliable pattern is only indicative of future price movement, not a guarantee.
That being said, candlestick pattern analysis can be a helpful tool in your investment arsenal. It can provide valuable insights into market sentiment and help you make more informed trading decisions.
How do you read a candle pattern
When most people think of candlestick patterns, they think of the classic Japanese candlesticks. These are the candlesticks that have long upper and lower wicks, with a small body in the middle. The color of the body does not matter, as long as it is different from the color of the wicks.
There are many different types of candlestick patterns, but they all have one thing in common: they can be used to predict future price movements. While no candlestick pattern is 100% accurate, they can give you an edge when trading by providing clues as to where the market might be headed next.
Here is a quick guide on how to read some of the most popular candlestick patterns:
- The Hammer: This pattern forms when the market is falling and then reverses to close near its opening price. The long lower wick shows that sellers were able to push prices lower, but buyers eventually stepped in and pushed prices back up. This shows that there is still demand for the security even at lower prices, which could mean that prices will continue to rise.
- The Hanging Man: This pattern looks like a inverted hammer and forms at the top of an uptrend. It shows that although buyers were able to push prices higher, they were not able to maintain these gains and sellers eventually stepped in. This could be a sign that the uptrend is losing steam and prices may start to fall soon.
Also Read: What Is the Head and Shoulders Pattern