

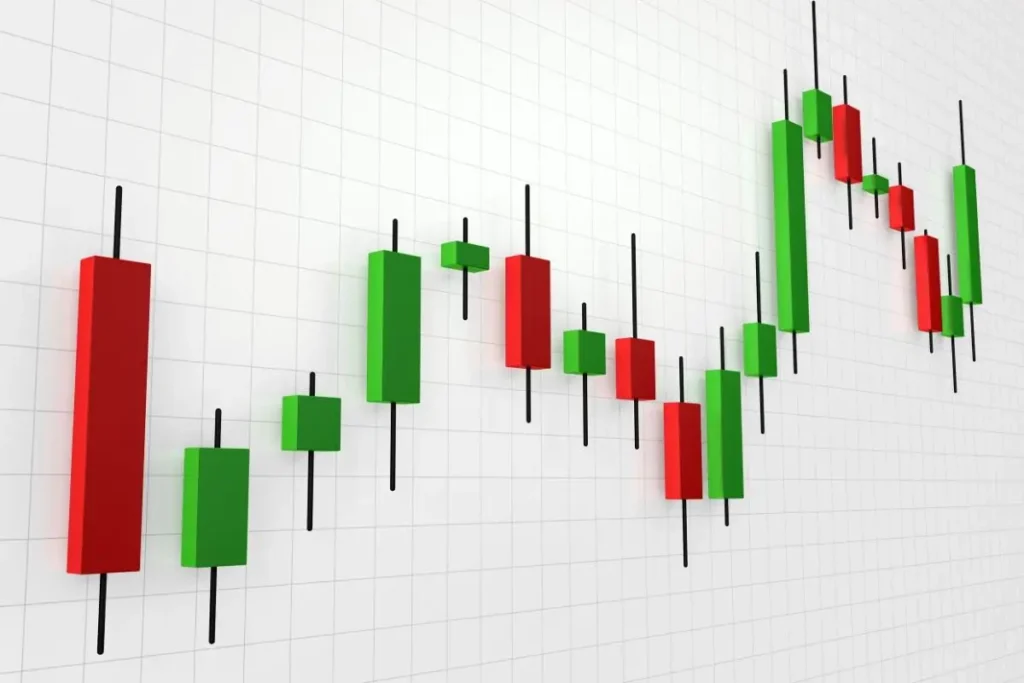
A candlestick pattern is a special type of chart that shows the open, high, low, and close price of an asset over a set period of time. Candlestick patterns are used by traders to identify potential reversals in the market. There are many different candlestick patterns, each with its own name and interpretation. Some common candlestick patterns include the hammer, the inverted hammer, the bullish engulfing pattern, and the bearish engulfing pattern. In this blog post, we will take a closer look at what candlestick patterns are and how they can be used to trade the markets.
What is candlestick pattern?
Candlestick patterns are graphical representations of price movements over a given period of time. They are often used by technical analysts in order to predict future price movements.
There are many different candlestick patterns, each with its own meaning and implications. Some of the more common patterns include the hammer, inverted hammer, shooting star, engulfing pattern, and morning/evening star.
The Benefits of Candlestick Patterns
Candlestick patterns are one of the most important tools that traders use to analyze price data. There are many different candlestick patterns, each with its own interpretation.
Some of the most common and useful candlestick patterns include the following:
Doji: A doji is a candlestick pattern that indicates indecision in the market. It is formed when the open and close price are equal, or very close to equal.
Hammer: The hammer pattern is a bullish reversal pattern that forms after a period of decline. It is characterized by a small body with a long lower shadow. This pattern indicates that selling pressure has exhausted and that buyers are beginning to take control of the market.
Hanging Man: The hanging man is a bearish reversal pattern that forms after a period of advance. It is characterized by a small body with a long upper shadow. This pattern indicates that buying pressure has exhausted and that sellers are beginning to take control of the market.
Engulfing Pattern: The engulfing pattern is a two-candlepattern that can be either bullish or bearish. A bullish engulfingpattern forms when a small candle is followed by a large candlethat completely engulfs it. This pattern indicates that buyersare taking control of the market from sellers. A bearishengulfing pattern forms when a large candle is followed by asmall candle that completely engulfs it. This pattern indicatesthat sellers are taking
How to Use Candlestick Patterns
Candlestick patterns are one of the most important tools that traders use to analyze price action. There are many different candlestick patterns that can be used to identify potential reversals, continuations, and other important market movements.
One of the most important things to remember when using candlestick patterns is that they are best used in conjunction with other technical analysis tools. For example, if a candlestick pattern is forming at a key support or resistance level, it can be a very powerful signal.
Another thing to keep in mind is that candlestick patterns can often give false signals. This is why it is always important to confirm signals with other technical indicators before taking any action.
If you are new to trading, it is always a good idea to practice identifying candlestick patterns on a demo account before putting real money on the line.
Types of Candlestick Patterns
There are three main types of candlestick patterns: bullish, bearish, and neutral.
Bullish candlestick patterns indicate that prices are expected to rise. Bearish candlestick patterns indicate that prices are expected to fall. Neutral candlestick patterns indicate that prices are not expected to move up or down significantly.
The most common bullish candlestick pattern is the hammer. The hammer has a small body and a long lower shadow. This indicates that the market has been testing support levels but has ultimately found enough buying interest to push prices higher.
The most common bearish candlestick pattern is the inverted hammer. The inverted hammer has a small body and a long upper shadow. This indicates that the market has been testing resistance levels but has ultimately found enough selling interest to push prices lower.
The most common neutral candlestick pattern is the doji. The doji has a small body with equal highs and lows. This indicates that there is no clear direction for the market and that prices are likely to consolidate in the near-term.